Data scientists can take a lesson from Abraham Wald.
Wald is a perfect example of how data problems require equal portions of creativity and science.
As a young mathematician educated in Vienna in the early 1900’s, Wald was forced to flee to the U.S. prior to the outbreak of war. Aside from being a brilliant mathematician, and a world authority on probability theory, he had a unique way of approaching data problems. He was a perfect example of thinking outside the box.
During the second world war, the US government established the Department of War Mathematics. Staffed with top mathematicians, one of the more important files they were tasked with, was an optimization problem of sorts.
The Allies were losing fighter planes at an alarming rate. Over the course of the war,any given plane had what amounted to a 50/50 chance of surviving. These were large, relatively slow aircraft, and as such were easy targets from any angle. Not surprisingly many of the planes returning to base after a mission were significantly damaged from ground flack and enemy bullets.
The military realized that they needed to reinforce parts of the plane, but which parts, and by how much. Adding too much would make take off and flight difficult if not impossible. So the engineers needed to know where they should add the armor in order to reduce fatalities while at the same time, minimizing added weight.
Wald began with an analysis of the data. He used what data science today calls visualization techniques. It is the process of viewing data visually to aid in developing a solution and subsequently presenting it effectively.
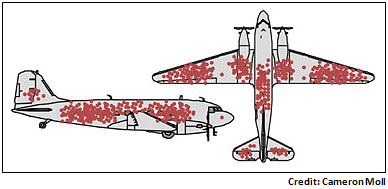
Taking the collected data from the planes after battle, he marked a simple schematic of the airplane to indicate where each received damage.
This clever use of an early “infographic”, provided the military and Wald with a clear analysis of the planes vulnerable areas. The most vulnerable surface areas were easily identified.
The conclusion to be drawn from the results was however not as obvious.
The military saw the parts that were most prone to damage. Their conclusion: reinforce the pieces most damaged. On the surface, a seemingly commonsense deduction.
Wald looked at the same drawing and drew another conclusion totally. He believed that those parts of the plane with minimum damage was where real problem lay. His reasoning was brilliant. It wasn’t that those areas were not being hit, but that when they were hit, the damage was fatal. Those were the missions that never returned and so never included in the data.
“Do not put your faith in what statistics say until you have carefully considered what they do not say.”
William W Watt
As an example, in studying the diagram, we find very little damage at the front of the plane. It’s not too hard to conclude that any attack on the cockpit would certainly be deadly and never reported.
The failure to take into account what we don’t see is what is called survivorship bias.
It’s the same reason mutual funds leave out po’or performers in their reports, or why it seems like some people always win at the casinos. It’s because the failures are hidden.
For the past 20 years, Retailers have used client data to promote sales and to reduce churn. The historical information was sliced and diced according to the retailers past experiences. Customers would be classified according to various criteria, including shopping frequency, the volume of purchases, and perhaps profitability. These may have worked in the past for them, so retailers keep going with what they know. What is needed is a way to remove survivorship bias from the process.
Data mining techniques can be used to remove bias from past experiences. Let the data speaks for itself. Segmentation, an approach to classifying customers into optimal groups, is where data science is taking us. Without computer-based algorithms that take into account multi-dimensional data, we are merely using what we have seen before, and ignoring what we haven’t.
It’s not the volume of data that’s the issue, its understanding which elements are the most important, those that gives us the optimal grouping.
In addition, e-commerce has given us new criteria to contend with. What is important gets lost in the mix:.Is gender more important than time of day purchased? Or is the number of abandoned carts more critical than the number of returns. Perhaps your best customers like to shop on rainy days, or on school holidays.
Segmentation is, of course, easier said than done. The path includes:
- Deciding on the data elements to use. There are an overwhelming number of criteria. (returns, shopper age, last date on website, weather on day)
- Decide how to obtain all the data needed. A lot of it will not be in your own database (weather, holidays, local events)
- Collect and prepare data for analysis
- Select the segmentation algorithms. There will be a trial and error process required to find the best models.
- Compare and test
- Communicate the results to necessary gatekeepers
- Integrate results with your current operational systems
It’s not a simple, nor is it a quick process to implement. However, case after case points to positive business improvements. (see below)
Other sources:


